If you’re running a site that collects and/or processes data, you’ll want to have a tool that enables you to work the numbers in the confines of website platform directly, most commonly in various tables.
Working with any kind of software, where you then have to export or copy/paste your work runs the risk of compatibility issues on several fronts. These can range from scrambled columns and rows, unsupported formats or formulas that simply don’t translate well.
If you work with #tables and #charts and need an elegant #WordPress solution, @wpDataTables is the plugin you simply can’t miss out. Click To TweetEncountering any of these issues (and more) means you’ve wasted your time for nothing and you have to do the work all over again. To put a stop to this, we’ve found a WordPress plugin that could prove to be a solution to all of these issues – the wpDataTables plugin.
The plugin is developed by TMS (the same company that developed well-known appointment booking plugin Amelia).
Tables for all occasions
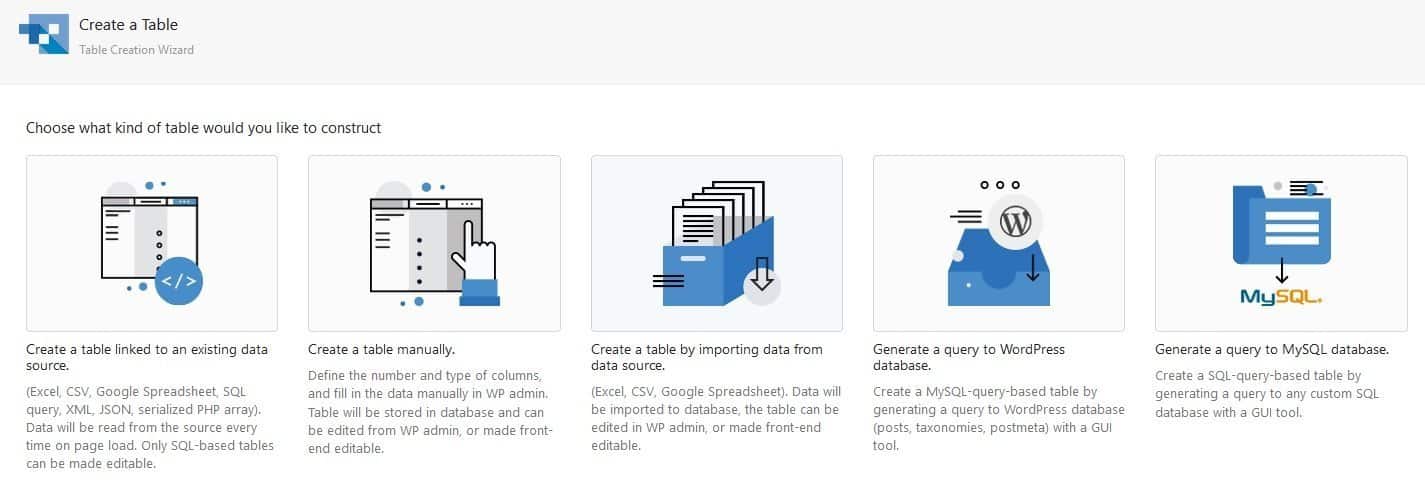
Although wpDataTables is a robust tool for data collection and processing it really isn’t that hard to use. When starting up you’ll be able to use a wizard for creating a new table, where you just need to follow the simple instruction and in a few steps you have your first table.
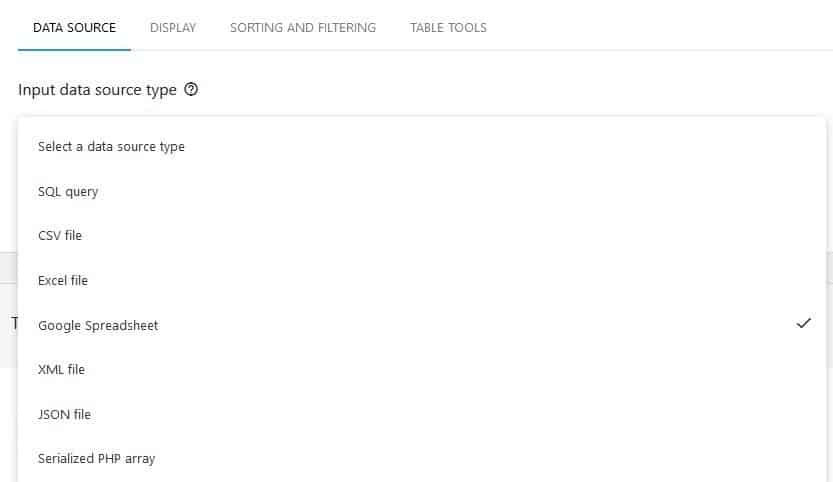
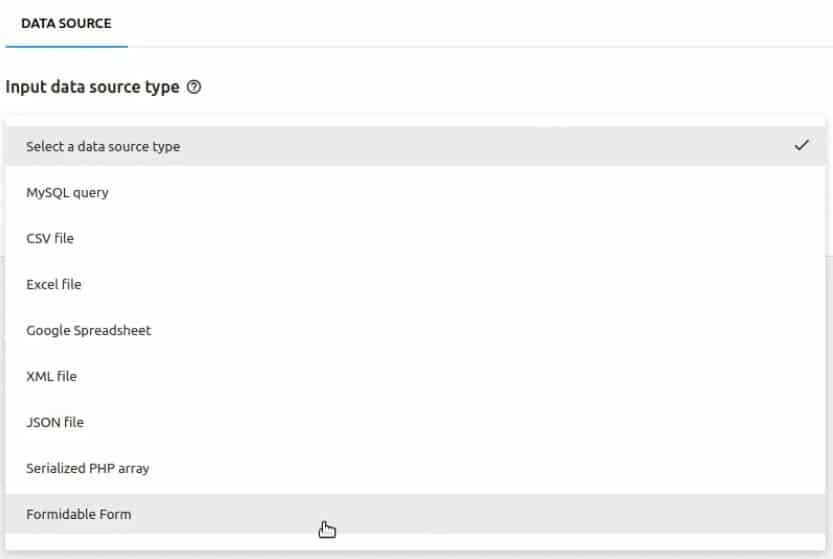
The first thing you’ll have to settle on is the data source. You’ll get to create tables by linking data, importing whole, already made tables, using SQL, or manually creating one from scratch.
Once you know from where the data will come from, it’s time to input the source type, which is crucial for formatting the table, both visually and functionally. The plugin covers all most commonly used data types, so you shouldn’t have any compatibility problems.
With the functionality out of the way, you’ll need to set up how the whole thing will behave from a visual standpoint and how it will look in general. These are the basic display options that are applied to the whole table, additional visual options can further be changed for specific parts of the table.
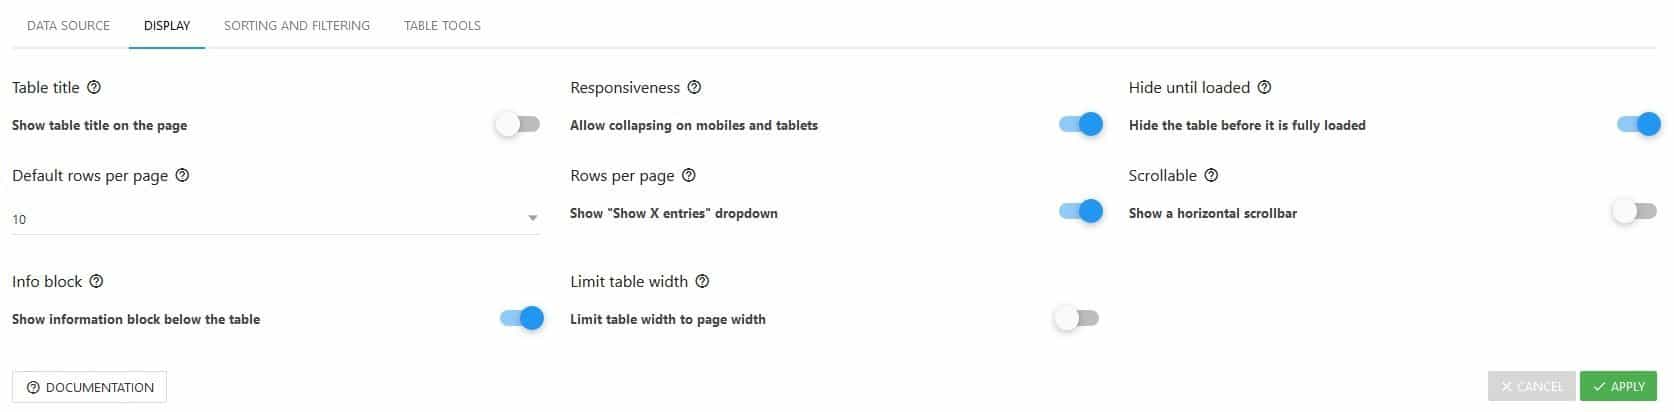
Everything here is rather straightforward, like choosing whether the table is displayed before it’s loaded, or how many rows will be displayed on the page. If there is one thing to point out, it has to be to always keep collapsing on smaller screens enabled. All tables created with the plugin are fully responsive and since people use phones and tablets to browse in equal measure, if not more than desktops that should be respected. To put it more simply – if you have an option that eases the way your visitors can interact with the content you put up, why not use it.
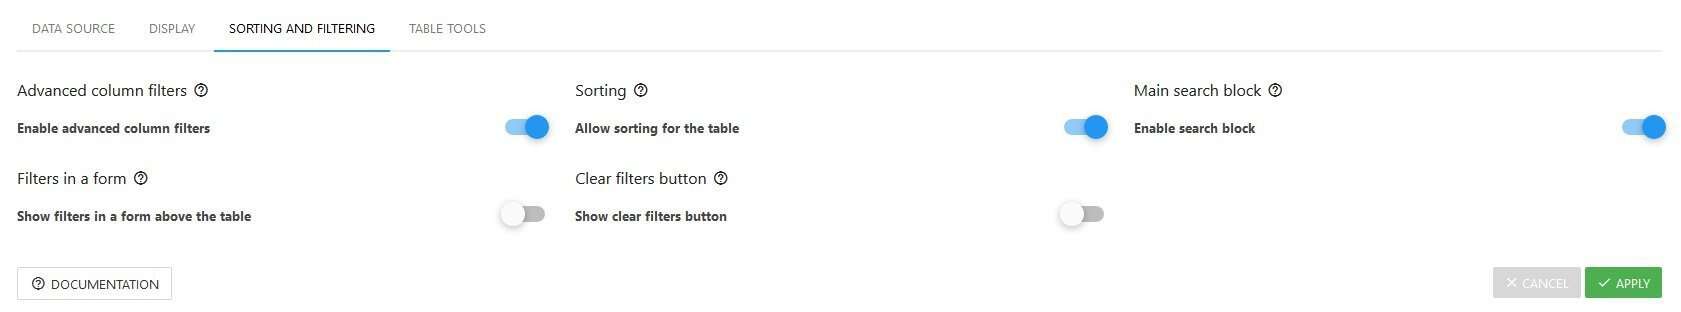
The reason we use tables as our primary tool for crunching numbers is that they provide an easy way to display lots of data that we can then compare, sort, filter through, or process in some other way. Anybody who has ever made a table in Excel knows this and with wpDataTables, you’ll have pretty much all the sorting and filtering functions as you would in an Excel table.
You can choose whether these options are displayed on the frontend based on how much freedom you’re looking to give your visitors.
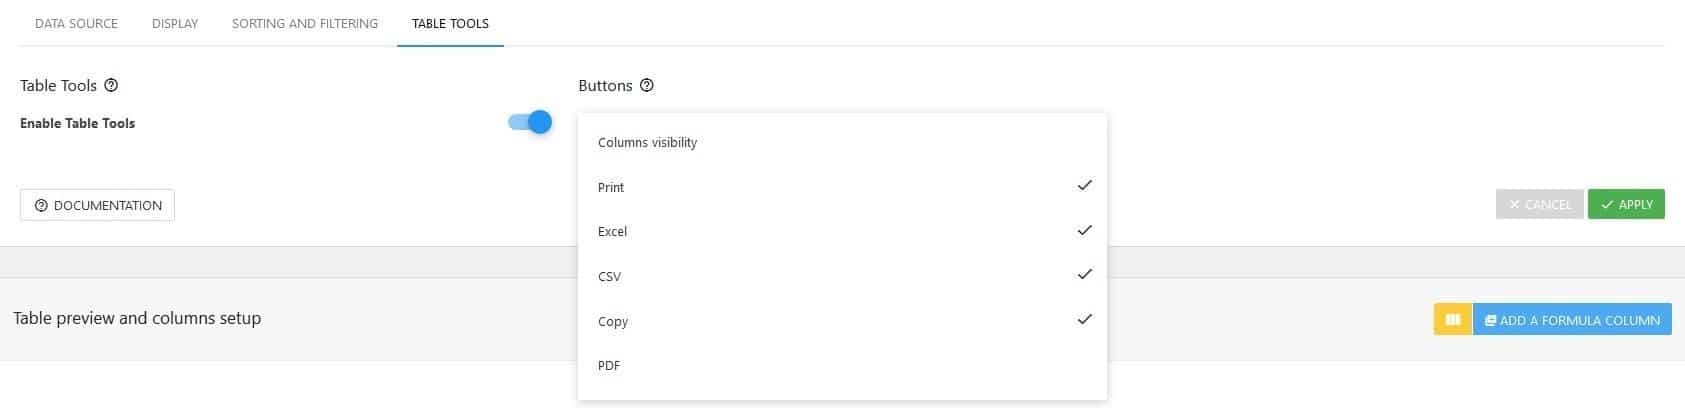
Speaking of giving your frontend user options, you’ll have to figure out what sort of tools they’ll be able to use. These extend to the ability to print out a copy of the table, export it in Excel, CSV or PDF formats, or even copy it in its entirety. Depending on what data is represented in the table you get to make this decision.
Familiar editing
Editing the table in general, as we’ve said sets up some rules that apply to the whole thing, but further customization is also available.
Below are all the settings you’re presented with a real-time table preview just like it looks from the frontend. You then have the option to edit it right then and there with no need to go through multiple windows or tabs.
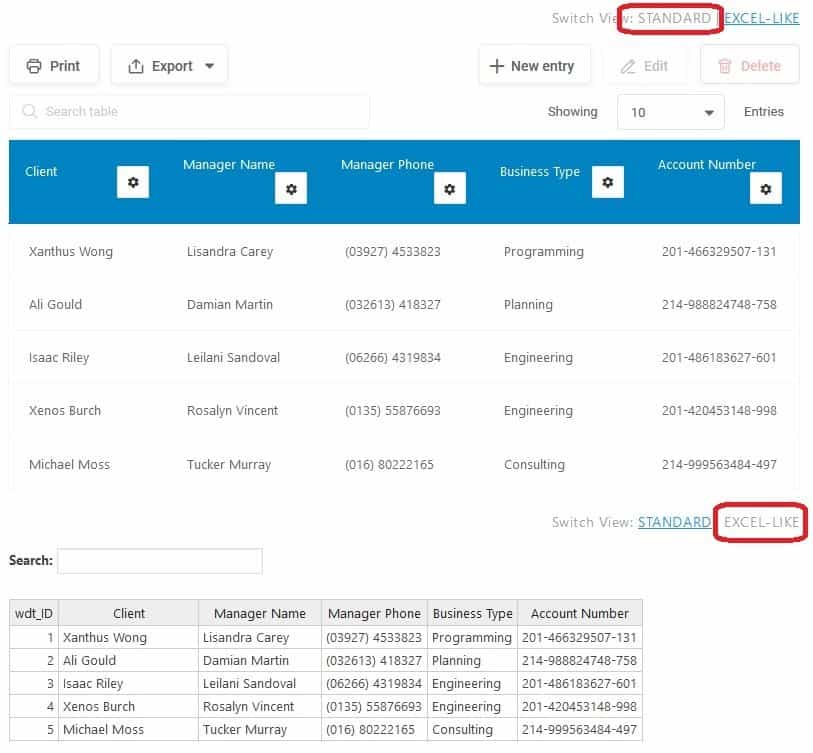
The default view is easy to use and fits perfectly with all the functions, but if you simply can’t get away from the classic excel view, you have the option to change.
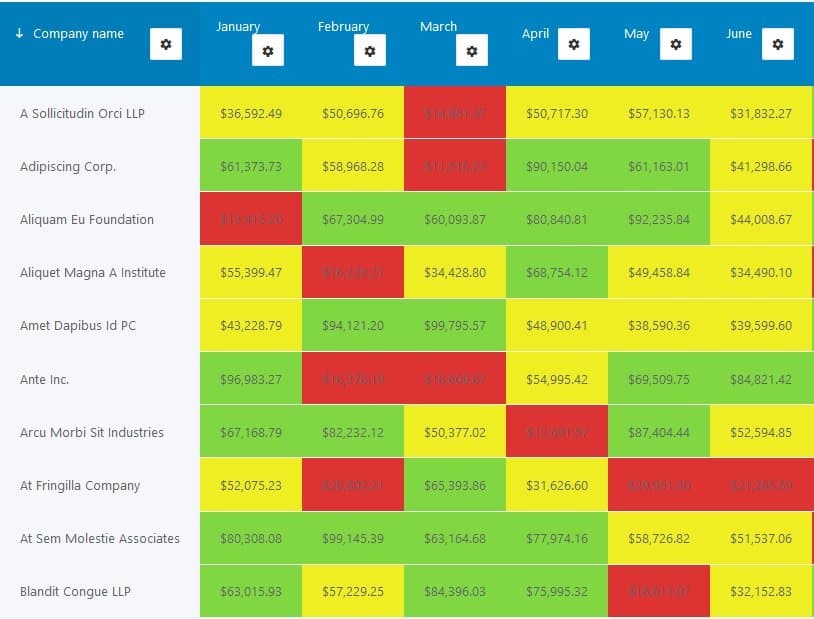
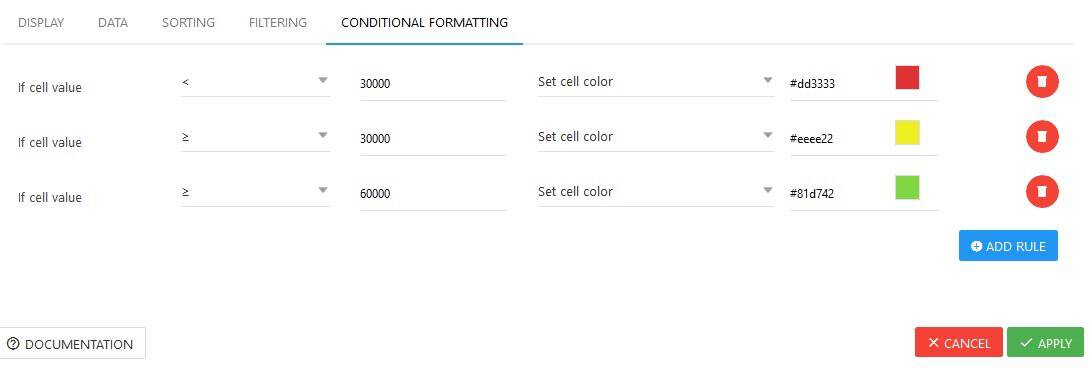
The similarities with Excel don’t stop there. When you’re editing columns, all options should look familiar. From cell formats and values, display or conditional formatting, you’ll get to change the options in much the same way you would do within an excel table.
All this contributes to the familiar feeling of using something you’ve already done hundreds of times before. This will get newcomers up to speed much quicker than if they have to learn the ropes from scratch with a totally new method.
Charts
Everybody knows that charts are to tables like cherries are to ice-cream sundaes. All the data you’ve collected can usually be summed up in a chart or two that will give the whole thing a new dimension. The process of adding a chart to your table is pretty simple. First of all, you need to choose which chart you’d prefer.
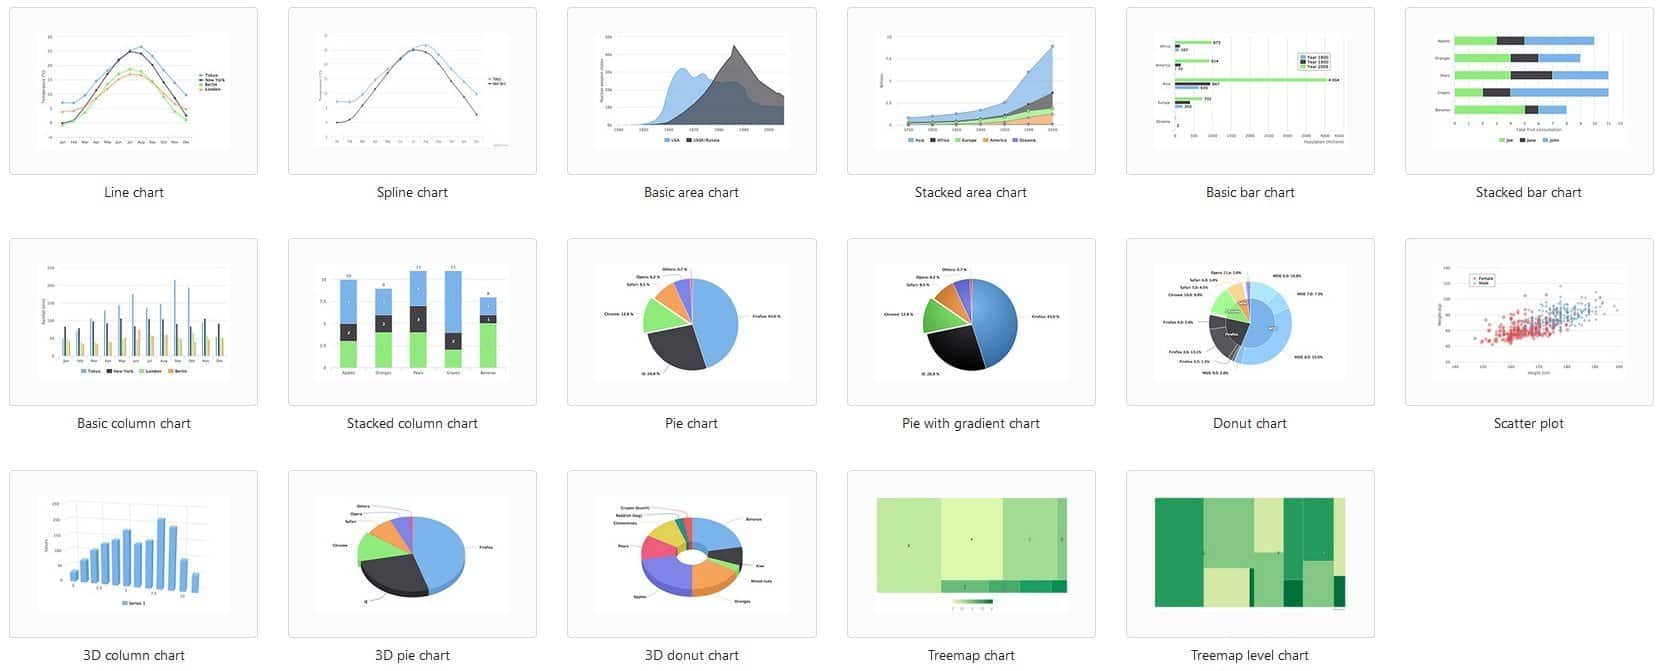
There’s ample to pick from, based on your preferences or the data they’ll be displaying. Next, you link it to the data source (any completed table you have in your database), after which you need to figure out which columns should be represented.
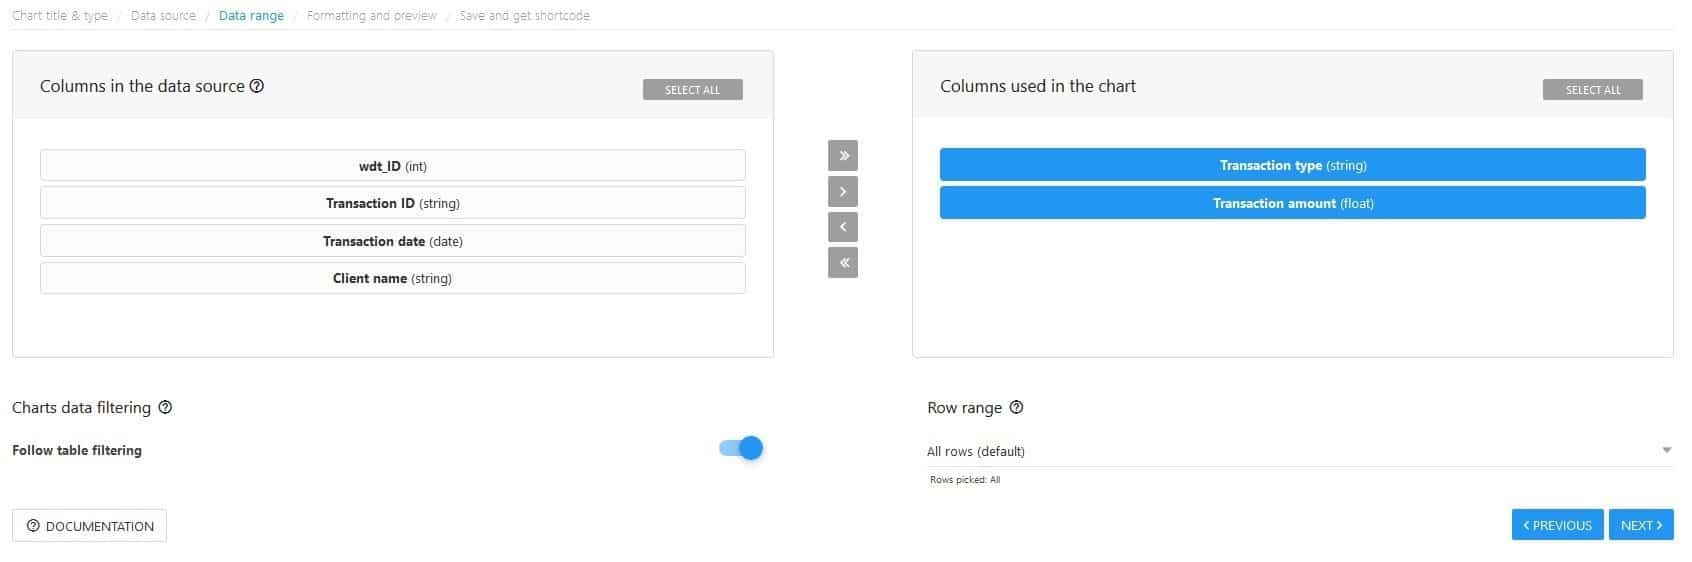
This is important since most charts can display the correlation for a certain amount of columns/variables and most tables have far more than can be displayed. Some of them are just for ordering and can be omitted from the chart. In any case, you’ll have to limit yourself to what the chart you’ve chosen can support.
Before you’re done you get the full preview of how the chart is going to appear from the frontend, as well as functions characteristic to charts mostly regarding display features and export options.
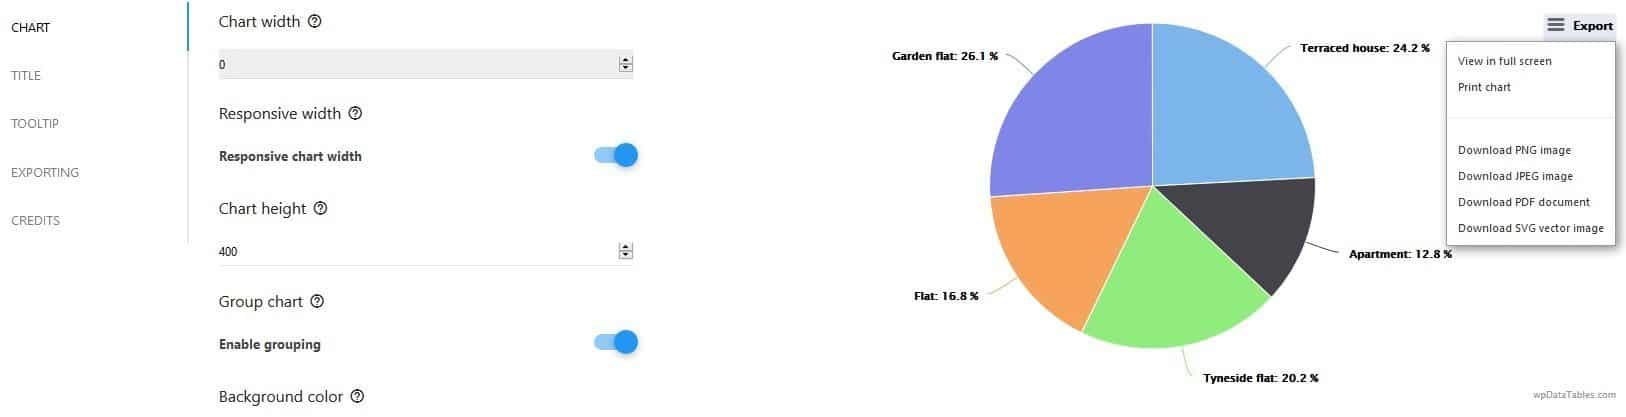
With that last look, you’re done. The chart is saved as-is and a shortcode is generated, which you can then use to implement on any page regardless of where the corresponding table is. Just like everything else the charts are responsive, easily scaling to any screen and are automatically updated based on the data in the tables.
Add-ons
There are currently four add-ons for the plugin that enhance the functionality in different ways each. They are all premium options, so you’ll have to pay to use them, however, if you’re serious about creating top-notch tables for your visitors you can’t afford not to give them a try.
Powerful filters
Just as its name suggests, this add-on improves the filtering options for your tables. This includes cascade filtering and hiding the table before filters are applied. There are two options of cascade filtering – dependent (left to right) and independent (free). Both essentially do the same thing, with the difference being that the latter is more open than the former.
In practice, this means that with dependent filtering you have to follow the strict order in which you filter data. For example, if you’re looking for a hotel, the path would be – continent, country, city, hotel, number of stars, etc.
The point is that you can skip over any filter, it has to follow the same order every time. On the other hand, independent filtering has the same filtering options, but you can choose which ones you want to enable. For example, you can start with the hotel name and work your way from there.
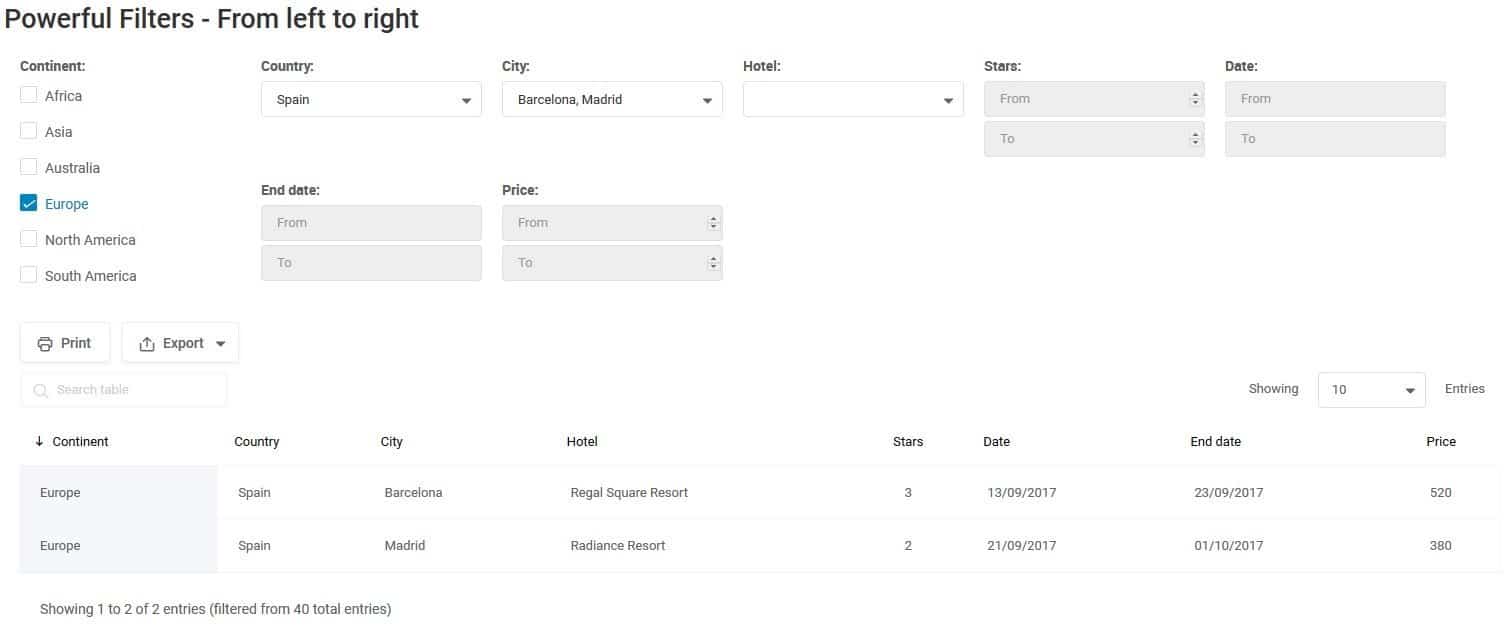
Both options have their merits. In our hotel example, if you don’t really know where you want to stay, but do know where you want to visit the dependent filtering option is better because it guides you along. In case you know precisely what hotel or city you want to stay in (maybe you’ve been there before), then it’s quicker and easier to use the independent filter.
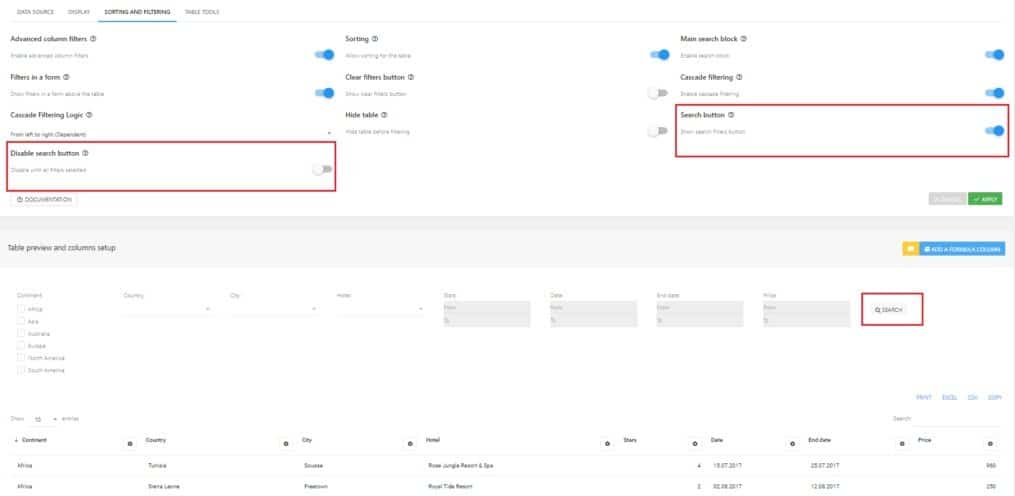
The other function of the add-on is enabling you to hide your tables and just display the filters. If you don’t want your visitors to see the table with all the data, then hide it and after they’ve inserted their parameters the table will show the results.
One seemingly small option here is enabling the search button. Without it, the results are shown automatically as the filters are being used. If the button is enabled, then the results will only be visible after your visitor clicks the button. The reason you’ll want to use this is similar to the reason you’d want to hide the table in the first place – your visitors don’t need to be encumbered with all that information – just give them what they need.
Report builder
Reports and tables usually go hand in hand. Using tables to process data so you can create a report is sometimes the sole reason you’re using them in the first place. Reports can, unfortunately, be a chore, especially if you have to make the same ones over and over again. This is precisely where the report builder shines. With it you can create reports using a predetermined template, eliminating the need to create the same form over and over again, all the while gathering the real-time data from the tables.
The inputs are called from both the frontend and backend and are immediately updated for report generation. This method ensures you won’t miss a beat and everything is always up to date. Reports can be generated in Word and Excel, each corresponding to a given situation.
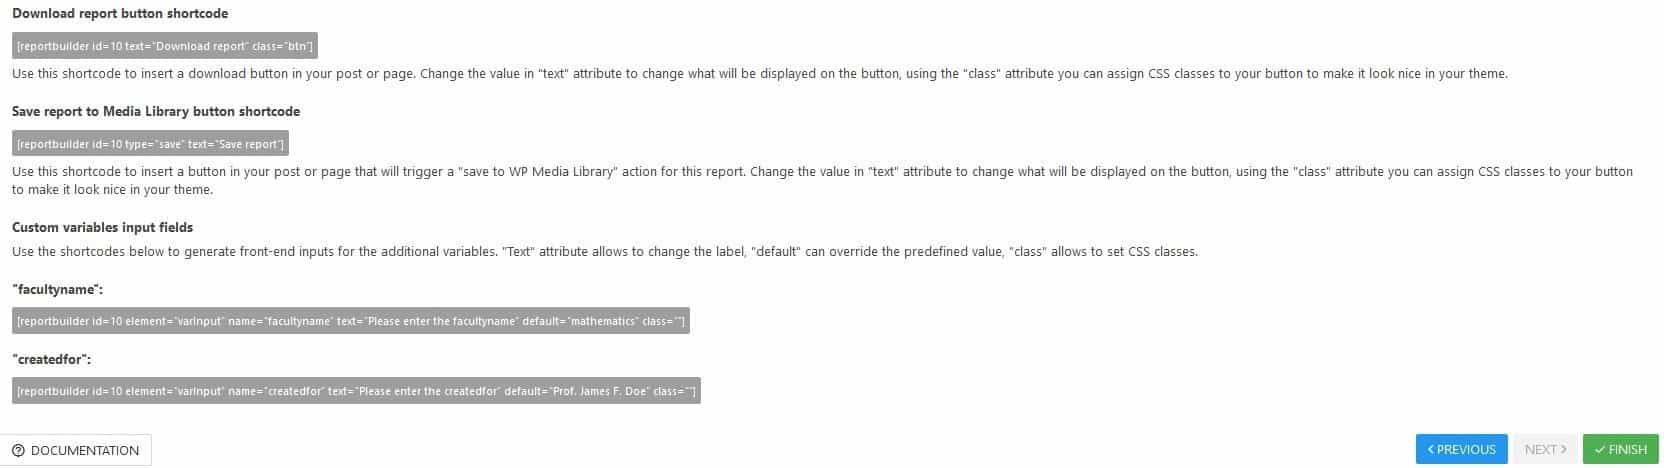
Enabling your frontend users to generate these reports is done through shortcodes that, when added to the page or post, create a button that enables the reports to be downloaded.
In the case of this particular add-on, most of the work is done in the start creating all the templates you’ll be using. After that is done everything else is pretty much streamlined to a couple of clicks for both the frontend and backend users since all the underlying work is done automatically in the background.
Gravity forms integration
Forms and tables are often tightly connected, using one to gather information for the other. One of two integrations with form plugins is with Gravity Forms. Just like you would guess creating forms for your fronted users can lead to gathering massive amounts of data for your tables, that can then be used to draw numerous conclusions regarding your particular field of interest.
Naturally, your first action will be to set up the forms you wish to use. Once that’s done it’s a simple matter of connecting the forms input fields to the columns of your tables. You can choose which fields you want to use and are not obligated to use all the fields that are represented in the form.
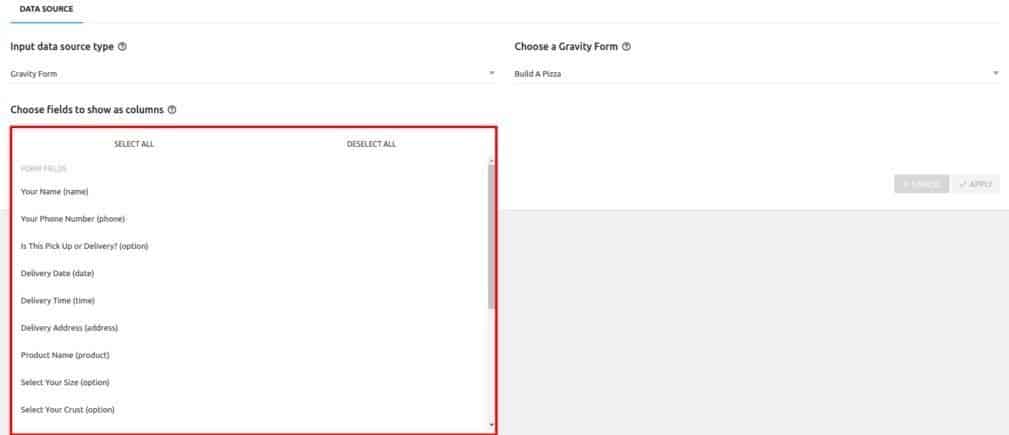
Creating a table from a Gravity field is the epitome of simplicity. You only need to choose the field as a data source while in the process of creating a table. The columns are then displayed in a known format that’s used for any other source type and you’re good to go. The completed forms can be viewed as pop-ups directly from the table in case you want to make further changes to the forms.
This is also a nice way to look at the complete form and inputs for an entry if you want more detail since the data in the table can be too much raw information sometimes. It should go without saying, but you have to have the Gravity form plugin installed in addition to having wpDataTables and the add-on.
Formidable Forms integration
Much like the previously mentioned Gravity Forms integration, this add-on represents the second integration to the plugin – the Formidable forms integration. The whole integration works just like the previous one, where you first need to have both the plugins and this add-on. After that, you’ll get to collect data for your tables from the fields presented on forms. Only forms with actual values can be used, but aside from that, no other limit applies.
Once you’ve used the forms as a source, the fields will represent columns in your tables and the values will be filled out automatically. The whole process is really a breeze and that’s probably the reason you’ll enjoy using it.
Summary
We’ve already mentioned that if you’re in any way providing data processing on your site you’ll need to use tables, there is simply no way around it. If you’re going to use them, why not use a solution that integrates its own spin on table editing as well as, the classic Excel look everybody already knows, giving you the best of both worlds.
No matter which method you’ll end up using there really isn’t any reason to look further than wpDataTables for anything table related on your site. And if you are still not convinced, see some real-life examples where the plugin is being used, and check out the demo yourself, and we are sure you’ll end up using the plugin on all of your sites.